RESEARCH ON NEUROPHYSIOLOGICAL
Signals and Systems, Uppsala University
|
|
|
|
|
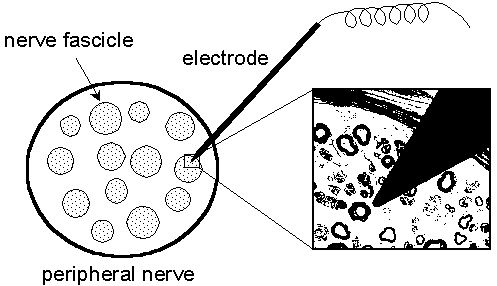
| Fig. 1.1. A schematic drawing of a nerve fascicle shown with an electrode inserted. The electrode is a 0.2 mm tungsten wire coated with an insulating layer except for the sharpened tip. The magnification shows the size of the electrode tip in relation to the diameters of the nerve fibers. (Courtesy of Prof. Erik Torebjörk, Dep. of Clinical Neurophysiology, Uppsala University Hospital, Sweden) |
Since the emitted APs cannot be detected and classified directly, an indirect method has been developed based on the fact that the conduction velocity of the thinnest nerve fiberes decreases directly after stimulation, followed by a gradual recovery to the normal velocity. Thus, the mentioned method estimates the conduction velocity of these fibers, and detects and classifies the APs indirectly by detecting the velocity-decrease.
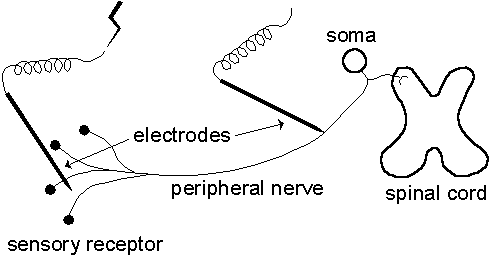
The conduction velocity can be estimated by measuring the time it takes for an AP to travel along a known distance. In our case, this is carried out by stimulating a sensory unit electrically near its sensory receptor causing an AP to be generated. The AP is recorded proximally along the fiber at a certain distance and its travelling time, called latency, is registered from which the conduction velocity may be calculated, see Fig. 1.2.
|
|
|
|
| Fig. 1.2. Electrical stimulation of a sensory unit shown schematically and highly idealized. The unit is stimulated electrically near its sensory receptor and the APs are recorded proximally along the nerve fiber at a certain distance. |
Electrical stimulation means, however, that several units are stimulated simultaneously and besides the unit of interest, others will give rise to recorded APs as well. But as the nerve fibers have slightly different conduction velocities, the units can be discriminated by their different latencies if the recording distance is long enough. Think of a relay-race where the runners are the fibers, the baton they carry is the AP, and the starting shot is the electrical stimulation. When the starting pistol fires, every runner that is close enough to hear it starts to run. In the beginning, all of them are running side by side, but the longer distance they run the more apart they get. Therefore, if the distance between the stimulation and the registration point is long enough, each unit will have a unique latency.
By stimulating electrically at a low frequency (one pulse every 4 second) and plotting the responses on top of each other, the APs from each recorded fiber will be found at the same position forming a vertical array of APs typical for each fiber. Thus, it is easy to discriminate between different units. Moreover, the detection of an extra stimulation is now very simple as this leads to a decrease in conduction velocity, i.e. an increase in latency, followed by a gradual return to the latency prior to the activation.
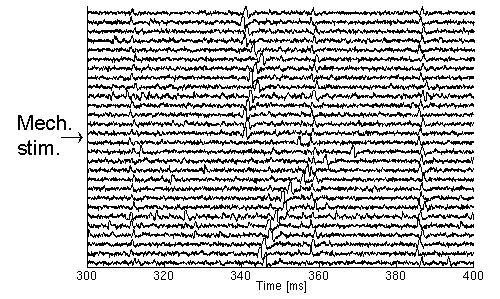
For these reasons, the latency is used directly, and instead of detecting a velocity-decrease a sudden increase in the latency should be detected. In Fig. 1.3., a recording is shown where the subject is stimulated mechanically in the middle of the registration. From this it is easy to see that four units are recorded of which one is activated by the mechanical stimulus. Note also that there are some disturbing APs in the end of the registration that would have been difficult to discard without this method.
|
|
|
|
| Fig. 1.3. The APs of four sensory units shown with approximate latencies 310 ms, 340 ms, 360 ms, and 390 ms respectively. In the middle of the experiment, the second unit is activated by a mechanical stimulus leading to a decrease in the conduction velocity, i.e. an increase in latency. Following this, the conduction velocity recovers gradually as indicated by the APs returning to the latency prior to the activation. |
Although easy to detect APs this way, it is a very tedious process to analyze a recording manually as it is normally several hours long. The goal of this project is to automatically detect and classify the APs, calculate the stimulation times, the recovery constants and other data that may be useful for the analyst.
2. EMG - Deconvolution of an MUAP into constituent SFAPs
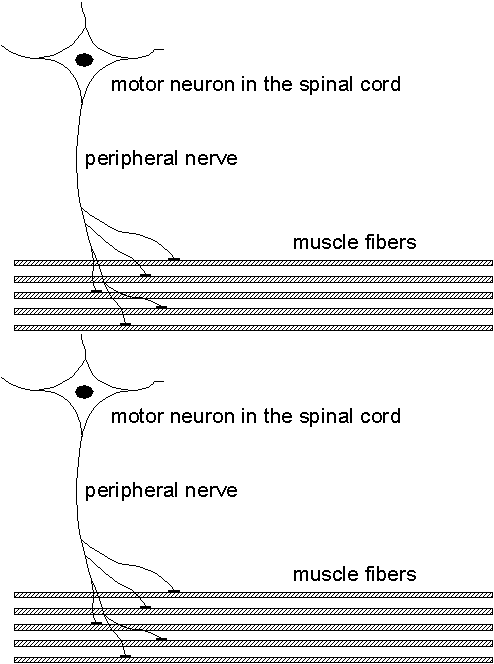
When diagnosing nerve and muscle diseases, the electrical signals measurable in the muscles play an important role as they provide a lot of information about the muscle and its nerve being studied. This project aims at improving the methods for analyzing these signals and to give higher resolution and new information compared to the present methods.The muscle is organized into functional elements called motor units (MU), consisting of 25-500 muscle fibers. The MU consists of a motor neuron in the spinal cord, a nerve fiber, and connected muscle fibers. When a motor neuron fires, all of the muscle fibers innervated by its nerve fiber will receive a firing inducing a muscle contraction. See Fig. 2.1.
|
|
|
|
| Fig. 2.1. The motor unit (MU) shown with its motor neuron, nerve fiber, and muscle fibers. Prior to a muscle contraction, the motor unit fires and the emitted spike propagates along the peripheral nerve and duplicates in the nerve fiber branches. When a nerve spike arrives at a muscle fiber, a single fiber action potential (SFAP) is generated which propagates along each muscle fiber and induces its contraction. |
In a normal muscle, each MU consists of hundreds of muscle fibers and each muscle consists of several MUs. Depending on the type of the muscle the actual number of MUs varies, and is typically in the order of 50-250.
Neuromuscular diseases, however, changes this balance. For example, if muscle fibers die, like in muscle diseases, they will not be replaced and the MUs will become smaller, i.e. contain less fibers. Using this fact, it is possible to detect a muscular disease by measuring the size of the MUs.
In the opposite case, i.e. when a nerve fiber dies, the muscle fibers connected to this nerve fiber will be 'out of control' and start to fibrillate. This initiates nearby nerve fibers to branch off and reinnervate the unconnected muscle fibers. As this happens randomly, the muscle fibers get connected to different nerve fibers and are reorganised into different MUs. This means that nerve damage leads to larger MUs, i.e. each MU contains more muscle fibers. The size of, or the number of muscle fibers in, the MU is thus an important feature when diagnosing neuromuscular diseases.
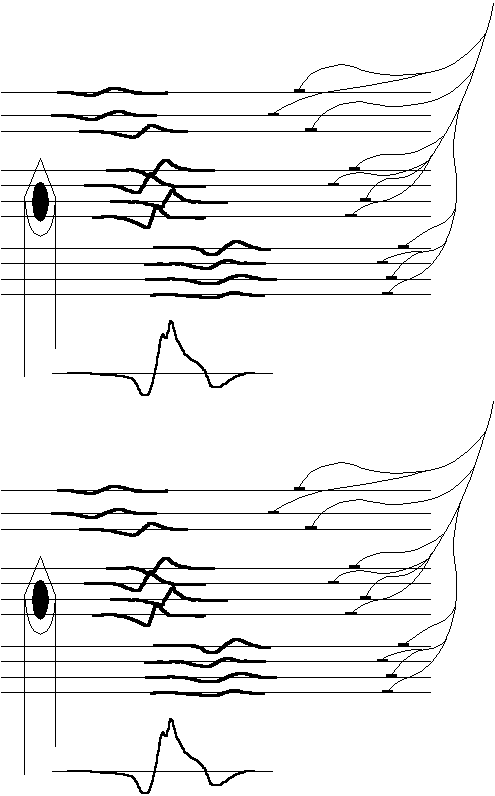
The size of the MUs can be found by studying the electrical signals in the muscle. During activation, a nerve action potential starts in the spinal cord, divides in the nerve branches, and continues to the muscle fibers. With a needle electrode in the muscle, a so called motor unit action potential (MUAP) can be recorded, see Fig. 2.2. The MUAP represents the sum of individual fiber spikes and reproduces with constant shape at repeated firings for the same MU. The shape of the MUAP is dependent on the number of muscle fibers and the temporal shift of the individual muscle spikes, and therefore changes with the above mentioned condition of diseases.
|
|
|
|
| Fig. 2.2. Highly idealized and simplified representation of a needle electrode inserted into a muscle measuring the motor unit action potential (MUAP). The SFAPs propagate along the muscle fibers and are summed by the electrode. Close fibers will contribute more to the sum than distant ones. |
As a patient with a muscle disorder has small MUs, the MUAPs will have short durations and small peak-to-peak values. For a patient with a nerve dysfunction and thus large MUs, the MUAPs will instead have long durations and large peak-to-peak amplitudes.
Currently, the amplitude and duration are used in daily routine in combination with other features to give an indirect measure of the sizes of the MUs. However, it is expected to improve diagnoses if information about individual contributing SFAPs (number, temporal dispersion) could be extracted from the MUAP. Therefore, this project aims at estimating the number of active muscle fibers, their configuration, and time relationship using modern signal processing methods in combination with todays knowledge in neurophysiology.

